
Results and project materials
1 / 6 Open in full size
2 / 6 Open in full size
3 / 6 Open in full size
4 / 6 Open in full size
5 / 6 Open in full size
6 / 6 Open in full size
About the project
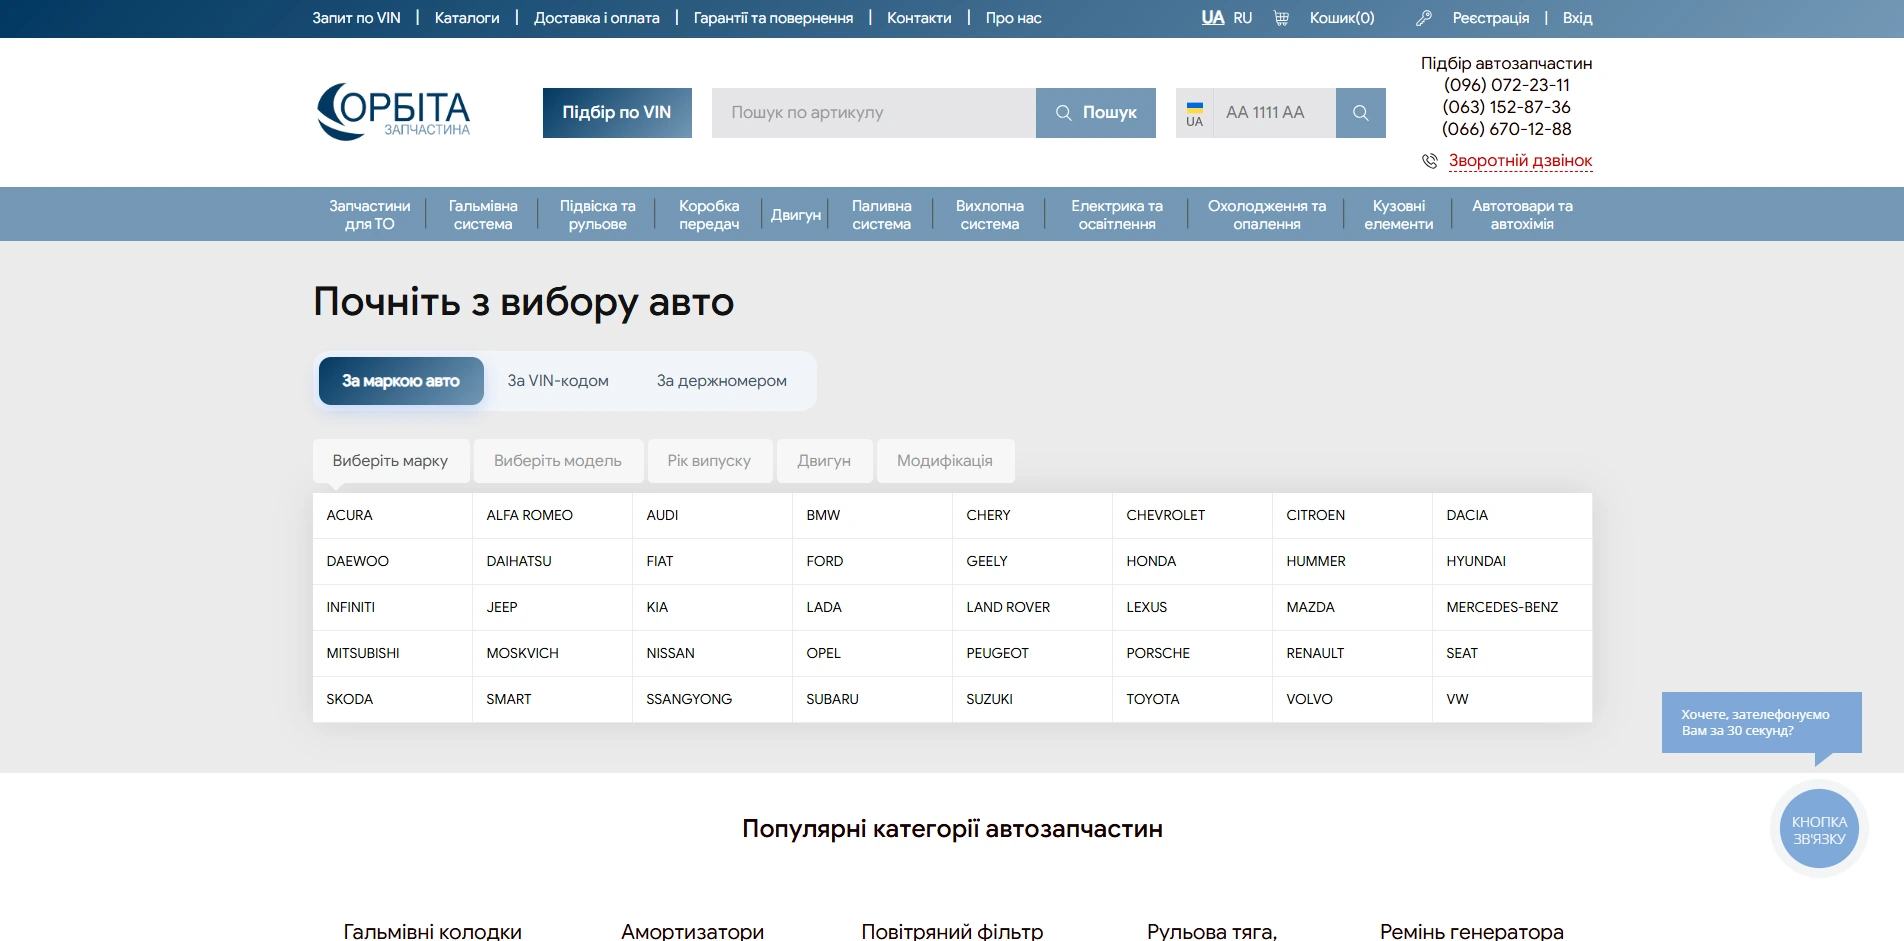
OZP (Orbita Zapchastyna) is a Ukrainian online auto parts store. iWeb began building its Google Ads account from scratch in late June 2026. The goal was to generate orders and parts-selection enquiries, then improve advertising performance using account data and client feedback.
Project website: ozp.com.ua · Market: Ukraine. This case compares the first two complete months of advertising: July and August 2026.
Preparing the store and measurement setup
We prepared a forecast, agreed the budget and provided recommendations to align the website with Merchant Center requirements. We created and configured Google Ads, Google Analytics 4, Google Tag Manager and Google Business Profile, then set up conversions, remarketing audiences and negative keyword lists.
A suspension made the Merchant Center launch more involved. We worked through the issue with Google representatives so that the store could use product ads.
The advertising channels we used
The Google Ads structure addressed parts searches, product advertising and returning visitors:
- Search campaigns organised by car make, plus a brand campaign.
- A general Performance Max campaign and Performance Max with product ads.
- Demand Gen campaigns.
- Display remarketing.
How we optimised after launch
Using campaign results and client feedback, we separated the highest-margin product categories. Product campaigns were progressively segmented by price. We regularly reviewed search terms, expanded negative keyword lists, tested bidding strategies and relaunched campaigns to improve performance.
We added conversion events to track actions along the path to an order. We also recommended full call tracking: a callback request on the website and an actual phone conversation represent different stages of an enquiry.
July versus August: what changed?
| Metric | July | August | Change |
|---|---|---|---|
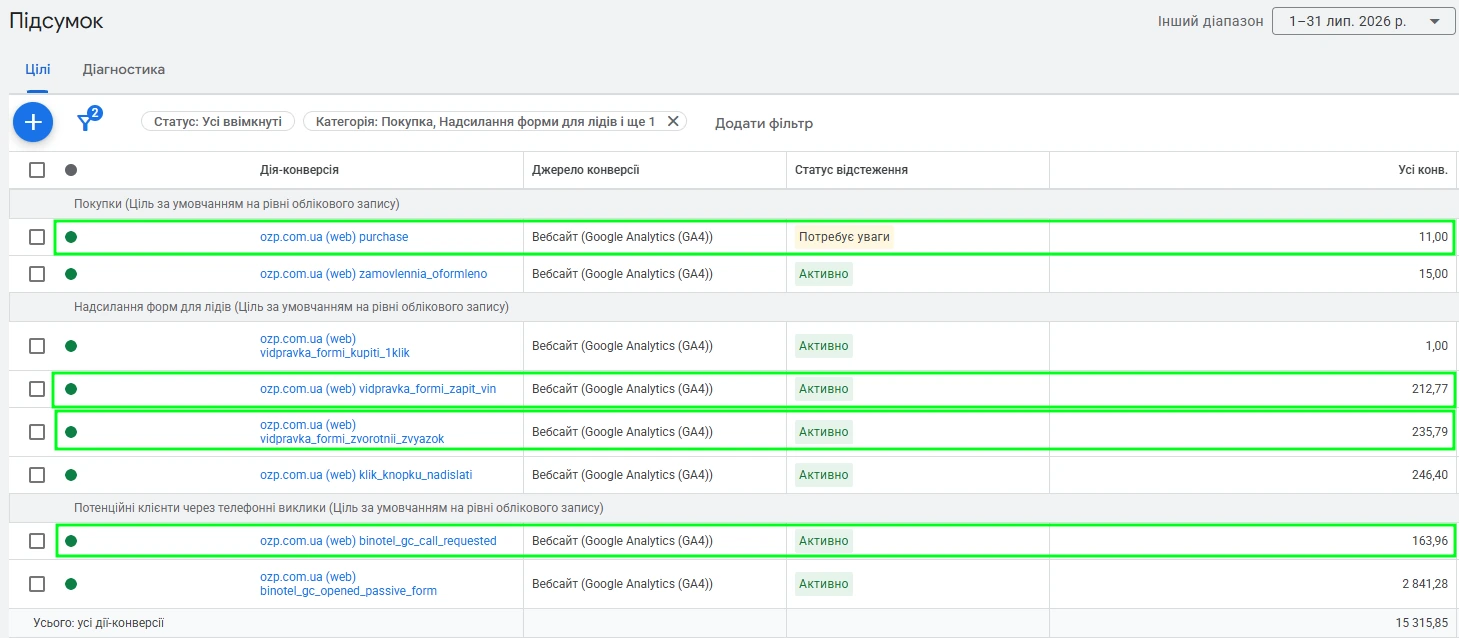
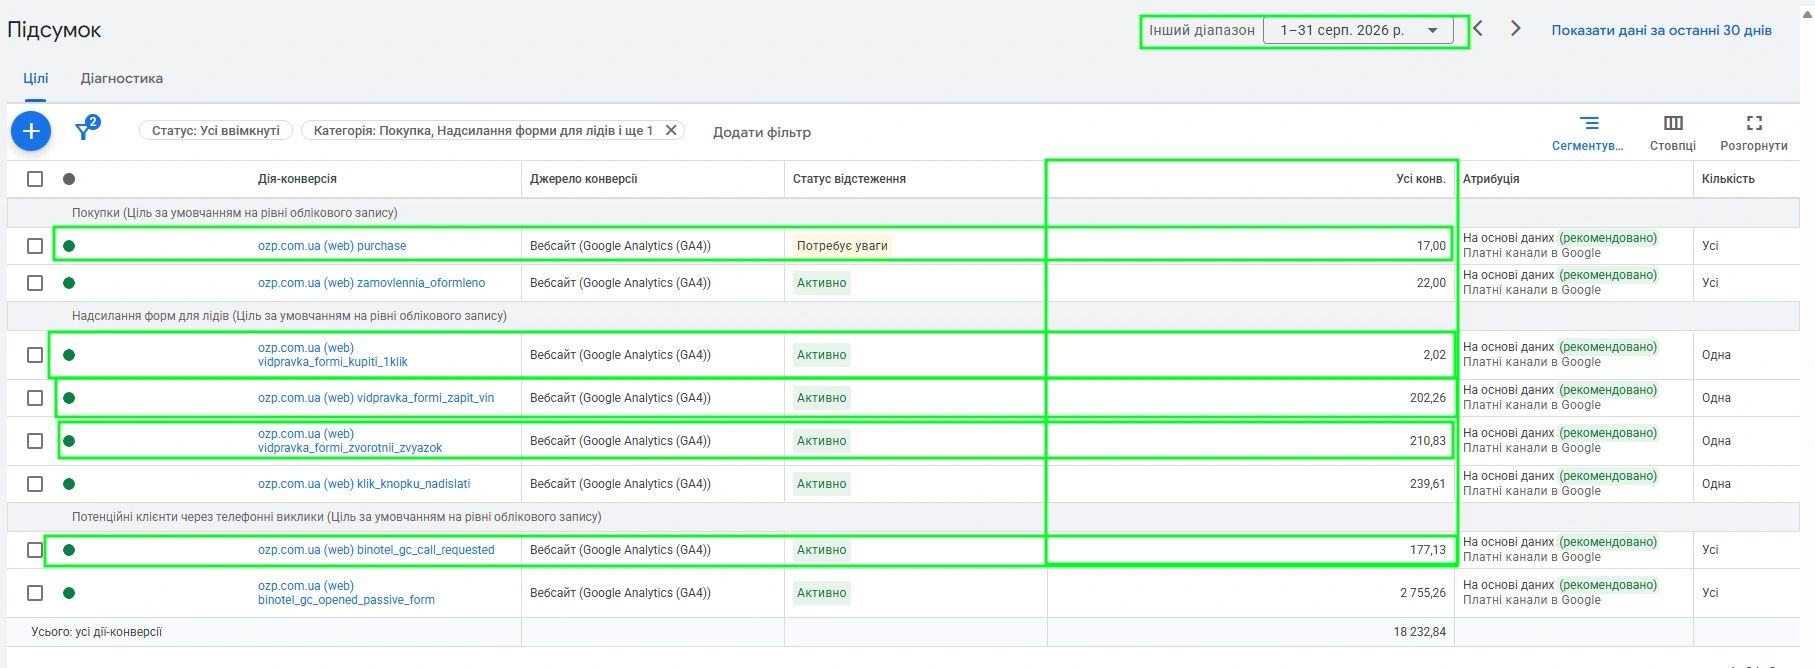
| Forms, all types | 449 | 415 | −7.57% |
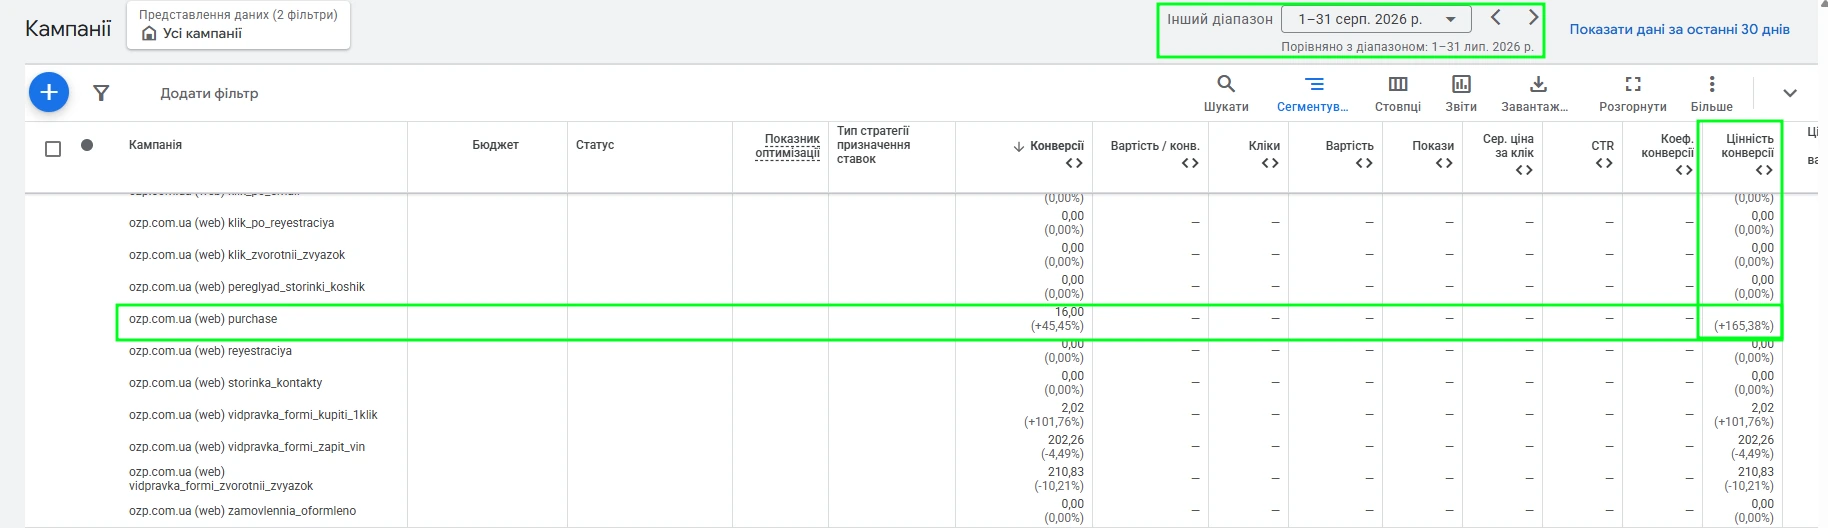
| Purchases | 11 | 16 | +45.45% |
| Callback requests | 164 | 177 | +7.93% |
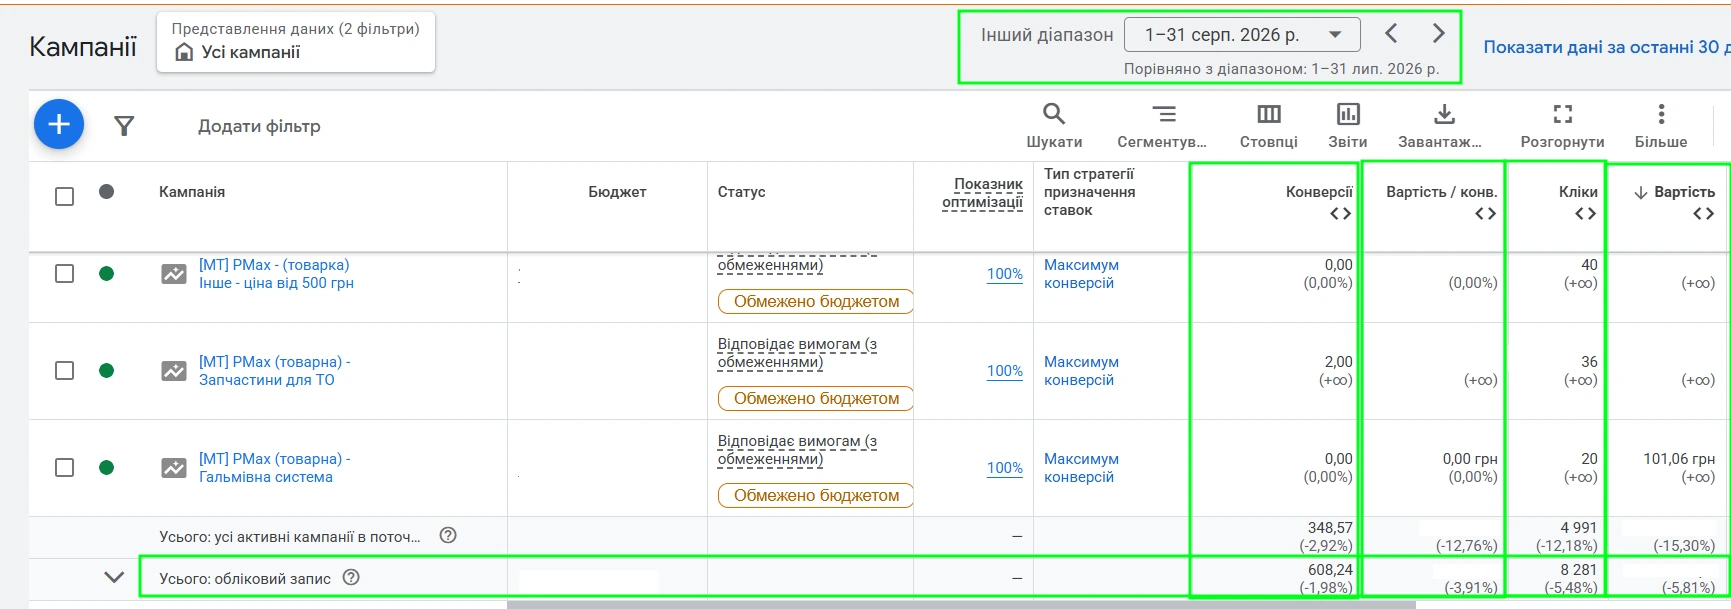
In August, ad spend fell 5.81% and CPA decreased 3.91% compared with July. The account received 8,281 clicks, down 5.48%. At the same time, tracked revenue from direct website purchases increased by 165.38%.
Forms and callback requests are reported as separate conversion actions. A person could complete more than one action, so these figures do not represent unique customers. The table follows the presentation’s rounded figures; Google Ads attribution reports may show fractional conversion counts.
Outcome
In its second month, the store recorded more online purchases and callback requests while spending less on advertising. Form submissions declined slightly, but tracked purchase revenue rose 165.38%. Product margins, segmentation and regular search-term and bidding reviews guided the optimisation work.

Services for your business
Let's start with the conversation
You have an idea.
We have the solution.
A few words about the business and the task. Let's discuss what next step would be useful.